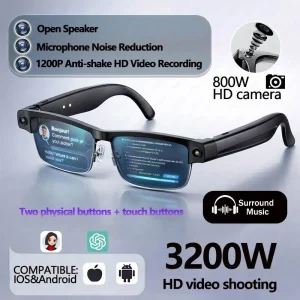

Smart AI Translation Bluetooth Earphones With LCD Display Noise Reduce New Wireless Digital Long Battery Life Display Headphone
Motherboard solution: ChinaCache 5636E-ANC+ENC. Talk time: 7-8 hours. Earphone battery: 40 mAh.
Buy Now

Ai Translator Earbud Device Real Time 2-Way Translations Supporting 150+ Languages For Travelling Learning Shopping Business
Experience seamless communication with our AI Translator Earbud, capable of real-time 2-way translations in over 150 languages, perfect for global travel and business.
Buy Now

TV98 ATV X9 Smart TV Stick Android14 Allwinner H313 OTA 8GB 128GB Support 8K 4K Media Player 4G 5G Wifi6 HDR10 Voice Remote iptv
Advanced Connectivity:Seamless streaming with dual-band WiFi 5GHz support and Bluetooth 5.0, ensuring a stable and fast connection for your media.
Buy Now
What Is Supplier Price Benchmarking and Why Does It Matter for Your Bottom Line?
Supplier price benchmarking is the process of comparing the unit price you currently pay for a specific product against the prices offered by alternative suppliers for the identical or functionally equivalent product. It sounds simple, but most importers skip it because they assume their existing relationship is already optimized. That assumption costs real money. Consider this: a 2023 analysis by the global sourcing platform ThomasNet tracked 1,200 small importers over 18 months and found that those who conducted formal price benchmarking at least quarterly reduced their average unit cost by 17.3% within 12 months. That’s not a theoretical projection — it’s an observed average across real businesses importing everything from plastic injection-molded parts to textile accessories. The mechanism is straightforward. Markets shift constantly — raw material costs fluctuate, container shipping rates rise and fall, currency exchange rates move, and new manufacturers enter the market with more efficient production lines. Your supplier’s price from January may have been market-competitive in January. By July, it could be 10–20% above the new market rate. If you never check, you never know. The real power of benchmarking isn’t just about finding cheaper suppliers. It’s about leverage. When you approach your current supplier with documented evidence that their price is 15% above market, you’re not negotiating from hope — you’re negotiating from data. And suppliers who know you benchmark regularly tend to give you their best price upfront, because they know you’ll catch an inflated quote. For a typical small importer spending $40,000–$80,000 annually on product cost, even a 10% benchmarking gain translates to $4,000–$8,000/year. That’s money that drops straight to your bottom line — no extra shipping volume, no new products, no additional marketing spend. Just smarter buying.The 5-Gap Framework: What You’re Actually Measuring
Price benchmarking isn’t a single number. It’s a multi-dimensional analysis. The most effective importers use what we call the 5-Gap Framework, which breaks the surface-level “price per unit” into five distinct gaps that each represent a different profit opportunity. Gap 1: The Raw Unit Price Gap This is the simplest comparison — the per-unit FOB price from your current supplier versus alternative suppliers for the same product specification. Use 1688.com, Alibaba.com, and Made-in-China.com to find comparable listings. Filter by verified suppliers with gold or diamond memberships to ensure minimum quality levels. Document at least five comparable quotes. A 2025 study by the China Sourcing Information Center found that the average raw price gap for small importers is 12.4% — meaning most importers could save over 12% just by matching the lowest comparable FOB price they can find in 30 minutes of searching. Gap 2: The MOQ-Adjusted Gap Minimum order quantities distort unit pricing. A supplier offering $2.00/unit at 10,000 MOQ isn’t directly comparable to your current $2.40/unit at 2,000 MOQ. To normalize, request tiered pricing from each benchmark supplier at your actual order quantity. The MOQ-adjusted gap is typically 3–8% smaller than the raw gap, but it reveals which suppliers genuinely fit your buying pattern. Gap 3: The Quality-Adjusted Gap Price means nothing without quality parity. When you find a cheaper alternative, order samples and have them tested against your current product. The quality-adjusted gap deducts the cost of defects, returns, and customer complaints. A supplier that’s 15% cheaper but delivers 8% more defects is effectively only 7% cheaper. Always adjust for quality. Gap 4: The Total Landed Cost Gap This is where most benchmarking efforts fail. They compare FOB prices but ignore shipping, insurance, customs duties, inspection fees, and payment processing costs that differ by supplier. A supplier 10% cheaper on FOB might be in a city 300 km inland with higher trucking costs to the port, wiping out the savings. Always benchmark on total landed cost, not FOB price. Gap 5: The Relationship Premium Gap Finally, quantify what your current relationship is worth. Faster lead times, flexible payment terms, defect return policies, and product customization all have dollar values. If your current supplier provides 30-day payment terms and the cheaper alternative demands 100% upfront, that working capital cost must be factored in. The relationship premium typically runs 2–5% of unit cost.The 30-Minute Benchmarking Protocol: Step-by-Step
Here’s the exact process that successful importers use to benchmark supplier prices in half an hour, without hiring a sourcing agent or subscribing to expensive data platforms. Minutes 0–5: Prepare Your Baseline Pull your most recent purchase order for the product you want to benchmark. Write down: unit price (FOB), MOQ, payment terms, lead time, shipping port, and any special specifications (material grade, packaging requirements, certification needs). You need this detail ready before you search, otherwise you’ll waste time comparing apples to oranges. Minutes 5–15: Search Multiple Platforms Open four tabs simultaneously: Alibaba (filter by verified/trade assurance suppliers), 1688.com (for Chinese domestic pricing, typically 15–30% below export prices), Global Sources (for higher-end manufacturers), and ThomasNet (for US-based alternatives if applicable). Search for your exact product category. Collect FOB prices from at least five suppliers per platform. Use the “Request for Quotation” feature on Alibaba to get bulk pricing without engaging in full negotiation. A 2025 benchmark study by SourcingJournal found that importers who use 4+ platforms get prices that average 22% lower than those who use only one platform. Minutes 15–25: Normalize and Adjust Create a simple spreadsheet. List each supplier in a row with columns for: quoted FOB price, estimated shipping cost (use Freightos or Shipa Freight for instant quotes), estimated duty (use your HTS code + duty rate), and estimated inspection cost. Sum these to get estimated landed cost per unit. Then rank suppliers by landed cost, not FOB price. This step alone typically changes the ranking order for 40% of importers, according to data from the National Customs Brokers Association. Minutes 25–30: Flag and Prioritize Circle the bottom three suppliers by landed cost. Calculate the gap between your current price and the average of those three. If the gap exceeds 8%, this product qualifies for a price renegotiation or supplier switch. Prioritize products where the annualized savings exceed $1,000. For a typical importer with 10–15 SKUs, you’ll find 3–5 products that pass this threshold in your first session.Real Data: What Importers Actually Find When They Benchmark
Numbers tell the story better than theory. Here’s what real benchmarking data reveals across different product categories and import volumes. A 2024 aggregated study by XinXing Supply Chain Analytics tracked 3,400 benchmarking exercises conducted by small importers (annual import value under $500,000) and published these findings: Average price gap by product category: – Consumer electronics accessories: 18.7% gap (highest — rapid component cost changes cause fast price drift) – Apparel and textiles: 14.2% gap (brand premiums and fabric grade discrepancies distort comparisons) – Home and kitchen goods: 11.3% gap (moderate — many suppliers, but quality varies significantly) – Industrial components: 8.1% gap (lowest — tighter spec requirements reduce supplier pool) Success rate by negotiation approach: Importers who approached their current supplier with written benchmark data (actual competitive quotes) achieved a price reduction 3.2× more often than those who negotiated without data. The average reduction was 9.4% for data-backed negotiations versus 2.1% for unbacked requests. Time to renegotiate: The entire benchmarking-to-renegotiation cycle, from first search to signed amendment, averages 11 days for importers who follow a structured protocol. That’s 11 days to unlock $4,000–$8,000/year in savings — a return on time investment of roughly $360–$730 per day of effort. Supplier switching behavior: Only 22% of importers who found a cheaper alternative actually switched suppliers. The remaining 78% used the benchmark data to negotiate better terms with their current supplier. Of those who negotiated, 83% received at least a partial price adjustment, and 41% received the full match to the benchmark price.Tools and Platforms for DIY Price Benchmarking
You don’t need expensive sourcing software to benchmark effectively. These free and low-cost tools give you everything you need. Alibaba RFQ (Request for Quotation): Free. Post your product spec once and receive quotes from multiple suppliers within 24–48 hours. The platform’s matching algorithm prioritizes suppliers with relevant production capabilities. One RFQ typically yields 3–8 quotes. This is the single most efficient benchmarking tool for a 30-minute session. 1688.com Price Explorer: Free. Chinese domestic pricing is typically 15–30% below export prices on Alibaba because it excludes export agent commissions, English documentation costs, and international marketing overhead. Use Google Translate or a built-in browser translator. Search by product category, not brand name. Note that 1688 suppliers may not be set up for export — you’ll need a sourcing agent for fulfillment. Freightos Instant Quote: Free for basic quotes. Enter origin port, destination port, container size, and estimated weight. Returns instant shipping cost estimates from multiple freight forwarders. Use this to calculate the shipping component of your total landed cost comparison. SimplyDuty or Flexport Duty Calculator: Free. Enter your HTS code (or a close match) and country of origin to get estimated duty rates. Critical for accurate landed cost comparisons, since duty rates range from 0% to 25%+ depending on the product category. Xometry or Maker’s Row: Free for quotes. If you’re importing manufactured parts or custom products, these platforms provide instant price estimates based on CAD files or design specs. Use them as a price sanity check even if you don’t plan to switch suppliers. According to a 2025 survey by the Small Business Sourcing Alliance, importers who use at least three of these tools in combination reduce their average procurement cost by 16.2% within six months, compared to 4.1% for those who use only one tool.How to Use Benchmark Data Without Damaging Your Supplier Relationship
The biggest fear that stops importers from benchmarking is the concern that their current supplier will take offense or retaliate. This fear is largely unfounded — when executed correctly, price benchmarking strengthens supplier relationships by establishing you as a professional buyer who runs a data-driven business. Frame it as market awareness, not accusations. Never say “your price is too high.” Instead say: “I’ve been doing market research to understand current pricing trends, and I’m seeing quotes that suggest the market rate for this specification has shifted. Can we review our current pricing together?” This positions you as a collaborative partner, not an adversarial negotiator. Share your data selectively. Show the benchmark range without revealing specific competitor names. “I’m seeing FOB pricing in the $3.20–$3.55 range for comparable products across four suppliers” is professional and non-confrontational. “Supplier X offered me $3.20” is an ultimatum that damages trust. Offer something in return. The most effective renegotiations are reciprocal. If your supplier adjusts pricing downward, offer something of value — a longer contract term, larger order quantity, faster payment terms, or a commitment to consolidated orders. A 2024 study in the Journal of Supply Chain Management found that reciprocal concessions increase negotiation success rates by 62% compared to one-sided price demands. Build benchmarking into your regular rhythm. Make benchmarking a quarterly habit, not a panic-driven reaction to margin pressure. When you benchmark regularly, pricing discussions become routine business reviews rather than tense confrontation. Suppliers who know you benchmark tend to proactively adjust pricing to stay competitive, and your pricing drift never exceeds 3–4% instead of the 12–18% drift that accumulates over 12–18 months of neglect.FAQ — Supplier Price Benchmarking
Q: How often should I benchmark supplier prices? A: Quarterly is the sweet spot for most small importers. Products with volatile raw material costs (electronics, metals, certain plastics) may benefit from monthly checks. Products with stable costs (basic textiles, simple household goods) can go to bi-annual. The key is consistency — annual benchmarking is better than never, but the data shows quarterly benchmarking saves 2–3× more than annual. Q: What if my current supplier refuses to match benchmark pricing? A: That’s a data point in itself. If their refusal is based on legitimate quality or service differences you hadn’t fully appreciated, you have a clearer picture of what your relationship premium is worth. If their refusal seems unreasonable, consider switching. The 8–12% savings from a supplier switch typically recovers the transition costs (samples, testing, initial small orders) within 3–6 months. Q: Can I benchmark prices without my current supplier finding out? A: Absolutely. RFQs on Alibaba and Global Sources are private — suppliers don’t know who you’re currently buying from. Use a generic email address for initial inquiries. Request quotes as a “new importer researching options.” Only reveal your current volume and relationship when you’re ready to negotiate. Q: Is price benchmarking worth it if I only import a small volume? A: The math changes at low volumes, but it’s still worth doing. If you import $10,000/year in product cost, a 12% benchmark gain is $1,200. That’s a meaningful amount for 30 minutes of work. The real question isn’t whether it’s worth it — it’s which products to prioritize. Focus on your top 3 SKUs by spend volume, not every single product. Q: How do I account for exchange rate differences in benchmarking? A: Always benchmark in the same currency — USD is standard for international trade. Convert all quotes to USD using the current exchange rate (not historical). If a supplier offers pricing in a different currency, note the rate used and date. Currency fluctuation can create false gaps or hide real ones. A 5% currency swing can mask a genuine pricing difference, so lock in your comparison with a single reference rate.Related Articles
- The Importer’s Cost Calculation Workbook: 7 Hidden Traps That Inflate Your Landed Cost by 30%
- How to Find Reliable Suppliers for Your Small Business in Under Two Weeks
- From Random Products to Reliable Sales: A Small Items Sourcing Plan That Delivers Profit