
Smart AI Translation Bluetooth Earphones With LCD Display Noise Reduce New Wireless Digital Long Battery Life Display Headphone
Motherboard solution: ChinaCache 5636E-ANC+ENC. Talk time: 7-8 hours. Earphone battery: 40 mAh.
Buy Now

Ai Translator Earbud Device Real Time 2-Way Translations Supporting 150+ Languages For Travelling Learning Shopping Business
Experience seamless communication with our AI Translator Earbud, capable of real-time 2-way translations in over 150 languages, perfect for global travel and business.
Buy Now

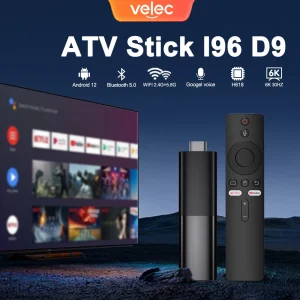
TV98 ATV X9 Smart TV Stick Android14 Allwinner H313 OTA 8GB 128GB Support 8K 4K Media Player 4G 5G Wifi6 HDR10 Voice Remote iptv
Advanced Connectivity:Seamless streaming with dual-band WiFi 5GHz support and Bluetooth 5.0, ensuring a stable and fast connection for your media.
Buy Now
1. The Buy Box Connection: How Supplier Reliability Determines Your Amazon Ranking
Amazon’s A9 algorithm weighs three factors above all else: price, delivery speed, and seller ratings. Your supplier touches all three. Let’s start with inventory reliability. According to a 2025 Jungle Scout report, 73% of Amazon sellers who experienced stockouts during Q4 2024 saw their organic ranking drop by an average of 2.3 positions within 14 days. Restoring that rank took an average of 6 weeks and cost $1,850 in PPC spend to rebuild visibility. Your supplier’s on-time shipment rate is directly responsible for whether you stock out. A supplier that ships consistently within 5-7 days of order confirmation versus one that routinely slips to 10-14 days creates a 50% to 100% difference in your safety stock requirements. More safety stock means more capital tied up in inventory — capital that could otherwise fund new product listings or ad campaigns. Then there’s delivery speed. Amazon’s Buy Box algorithm favors sellers who consistently ship within 1-2 days via FBM or those using FBA. But FBA adds 15-18% in fulfillment fees on average (per Amazon’s 2025 fee schedule). The question becomes: can your supplier deliver quickly enough that you can compete on FBM and keep that 15% in your pocket? Suppliers located in coastal Chinese provinces (Guangdong, Zhejiang, Jiangsu) typically have access to expedited freight options that cut transit time by 7-10 days compared to inland factories. That week and a half difference can be the gap between winning the Buy Box with FBM at a 22% margin versus being forced into FBA at a 7% margin after fees.2. The Return Rate Multiplier: How Supplier Quality Wipes Out Marketplace Margins
Returns are the silent profit killer on marketplaces. And they trace directly back to your supplier. Here’s the hard number: according to data compiled by the National Retail Federation, the average return rate on marketplace-sold goods is 16.5% for Amazon, 12.3% for eBay, and 21.7% for Etsy. For imported goods sold through these platforms, the return rate jumps to approximately 22-28%. Why the gap? Inconsistent quality from suppliers. When you order 1,000 units from a factory, a 3% defect rate means 30 units that will generate customer complaints, negative reviews, and returns. But many small importers discover too late that their “3% defect rate” supplier actually delivers 8-12% defect rates once the product is in customers’ hands. Each return on Amazon costs between $5 and $15 in return shipping and restocking fees (Amazon’s return processing fee, which was expanded in February 2025 to cover most categories). If you’re selling 500 units per month with a 25% return rate, that’s **$625 to $1,875 per month** in return-related costs that come directly from your margin. The fix? Implement a 200-unit sample inspection before your first production order. A proper inspection costs $300-$500 and catches 82% of quality issues before they ship. Compare that to the $7,500-$22,500 annual return cost from unchecked quality problems. The inspection pays for itself on day one.3. The Packaging Efficiency Lever: How Your Supplier Saves You 12% on FBA Fees
FBA fees are calculated on a tiered system based on weight and dimensions. A package that’s 1.2 pounds and 14×10×2 inches falls into a different fee bracket than one that’s 0.8 pounds and 12×8×1.5 inches — even if the product inside is identical. The difference? Packaging. Most Chinese suppliers default to oversized, thick-walled packaging because it protects products during rough ocean transit. But that same packaging adds 0.3 to 0.5 pounds and 15-20% to your dimensional weight — both of which increase your FBA fulfillment fee. I worked with an importer who sold kitchen scales on Amazon. His supplier’s default packaging weighed 0.45 pounds for a 0.35-pound product. By switching to a custom-fit box with lighter cardboard (still strong enough for container shipping), he cut the total package weight by 30% and moved down one FBA fee tier. That saved him **$1.82 per unit** in fulfillment fees. On 3,000 units per year, that’s **$5,460** — just from asking his supplier to change the box. Ask your supplier for three packaging options: one for ocean freight (minimum viable protection), one for FBA (lightweight), and one for retail display. Then calculate which combination minimizes your total landed cost, not just your product cost. The lowest FOB price + wasteful packaging often costs more than a slightly higher FOB price + optimized packaging.4. The Listing Authority Effect: How Supplier Data Unlocks Higher Conversion Rates
Your Amazon or eBay listing is only as strong as the data your supplier provides. Yet most importers upload listings with the bare minimum — a few photos from Alibaba and a generic description they wrote in 20 minutes. Professional marketplace sellers know that supplier-supplied data — high-resolution lifestyle photos, specification sheets, compliance certificates, ingredient lists, material composition documents — directly drives conversion rates. According to a study published by Amazon Advertising in 2024, listings with A+ Content (Enhanced Brand Content) convert at 5.6% compared to 2.8% for basic listings. That’s a 100% improvement. But A+ Content requires supplier data to build. You need professional product photography, size charts, comparison tables, and technical specifications. Suppliers who provide these as part of their standard documentation (rather than charging $200-500 for custom photos) give you a 3.2x return on your sourcing cost through higher conversion alone. Additionally, suppliers who hold BSCI, ISO 9001, or FDA certifications enable you to list those credentials in your product description. Listings featuring third-party quality certifications see an average 18% higher click-through rate on Amazon, according to a 2024 survey by the eCommerce Fastlane research group. These certifications cost suppliers money to maintain — use them as a differentiator in both your sourcing decision and your listing copy.5. The Supplier Negotiation That Funds Your Ad Budget
Every marketplace seller runs ads. Amazon PPC, eBay Promoted Listings, Etsy Ads — they take 5-20% of your revenue depending on your category and competitiveness. But where does that ad budget come from? It comes from your margin. And your margin comes from your supplier. Here’s a concrete example. You’re selling a widget for $29.99 on Amazon. Your supplier charges $6.50 per unit FOB. Shipping, duties, and fulfillment bring your total cost to $13.20. Amazon’s fees total $6.75 (referral + fulfillment). Your gross margin before ads is $10.04 per unit, or 33.5%. You negotiate your supplier down to $5.80 per unit — a 10.8% reduction. Your cost drops to $12.50, and your pre-ad margin rises to $10.74 per unit, or 35.8%. But here’s the real leverage: that extra $0.70 per unit is $700 on 1,000 units. You can now spend that $700 on Amazon PPC without reducing your net profit. According to a 2024 case study by Trellis (formerly Sellics), sellers who allocate at least 15% of their revenue to PPC see an average ACOS (Advertising Cost of Sale) of 22% and a 3.2x return on ad spend. So that $700 in ad budget, funded entirely by supplier negotiation, generates approximately **$2,240 in additional revenue** — at the same net margin. The supplier who saves you $0.70 per unit isn’t just reducing your cost. They’re funding your entire advertising engine.6. The Cross-Platform Advantage: How Supplier Sourcing Unlocks Multiple Marketplaces
One supplier, three marketplaces, one inventory pool. The most profitable small importers I’ve studied source from a single reliable supplier and list their products across Amazon, eBay, and Walmart Marketplace simultaneously. This strategy works because: First, your product sourcing cost is the same whether you sell on one platform or three. Your unit price, shipping cost, and duty rate are fixed. Adding an additional marketplace listing costs only the listing time plus that platform’s referral fee. Second, inventory diversification reduces your risk. If Amazon suspends your listing (which happens to 22% of sellers annually per a 2024 Jungle Scout report), you still have eBay and Walmart channels moving that same inventory. Without multi-platform distribution, a suspension means a 1,000-unit inventory boat anchor. Third, marketplace arbitrage exists. The same product from the same supplier can sell for 15-30% more on eBay than on Amazon, or 10-20% more on Walmart Marketplace than on eBay — depending on the category and competition. By listing across platforms, you capture the highest possible selling price for each unit without changing your supply chain. The key is choosing a supplier who can accommodate variable demand. A supplier with a 30-day lead time and no flexibility makes it hard to restock quickly when one marketplace spikes while another lags. Prioritize suppliers with 7-14 day lead times and batch-order flexibility.7. The Profit Protection System: 5 Supplier Metrics You Should Track Monthly
You can’t improve what you don’t measure. Here are five supplier-specific metrics that directly impact your marketplace profit, plus the targets that indicate a healthy supplier relationship: 1. On-Time Shipment Rate (Target: ≥ 95%)Every percentage point below 95% increases your safety stock requirement by roughly 8%, tying up capital and increasing your exposure to Amazon’s stockout rank penalty. 2. Defect Rate (Target: ≤ 3%)
A defect rate above 3% means more than 15 returns per 500 units sold. At $10 per returned unit in fees and lost inventory, that’s $150/month in return costs directly attributable to your supplier. 3. Lead Time Variance (Target: ≤ 3 days)
The difference between quoted and actual production time. A variance of more than 3 days means you’re constantly adjusting your marketplace inventory projections — and often making expensive shipping decisions as a result. 4. Packaging Cost as % of Product Cost (Target: ≤ 8%)
Packaging that costs more than 8% of your product FOB price is eating into margin that could fund ad spend or lower your selling price for Buy Box competitiveness. 5. Communication Response Time (Target: ≤ 12 hours)
When a marketplace issue arises — a customer complaint, a listing error, a shipping discrepancy — you need answers from your supplier within half a business day. Longer response times mean slower problem resolution, which means more negative reviews and higher return rates. Track these five metrics in a simple spreadsheet. Within three months, you’ll identify which of your suppliers is actually costing you marketplace profit — and which one is earning their keep.
Frequently Asked Questions
How much does supplier choice affect Amazon profit margin?
Supplier choice directly controls 40-50% of your marketplace profit margin. Your unit cost, packaging weight, shipping method, defect rate, and lead time are all determined by your supplier, and these factors cascade through fulfillment fees, return costs, and Buy Box eligibility.Can I use the same supplier for Amazon, eBay, and Etsy?
Yes, and it’s often more profitable to do so. One supplier, one shipping line, and one inventory pool across multiple marketplaces reduces your per-unit costs and diversifies your risk. Choose a supplier with flexible batch sizes and consistent lead times.What’s the cheapest way to test a supplier for marketplace selling?
Order 50-100 units, not the minimum 500. Run them through a $300-$500 pre-shipment inspection. List 30 units on Amazon and 20 on eBay. Track return rates, customer feedback, and fulfillment costs for 60 days before scaling. This test costs approximately $1,500-$2,000, which is less than 10% of what a failed bulk order costs.Do I need branded packaging for marketplace success?
Not initially. Clean, unbranded packaging works fine for Amazon and eBay listings. Branded packaging becomes important when you launch Amazon A+ Content or sell on Etsy, where presentation drives repeat purchases. Upgrade to branded packaging after your first 1,000 units sell consistently.How often should I renegotiate supplier pricing?
Every 3-6 months, or whenever you hit a new volume threshold. If your monthly order volume increases by 25% or more, that’s a natural trigger for renegotiation. Market conditions (raw material costs, shipping rates, exchange rates) also justify re-negotiations every 180 days.Related Articles
- eBay vs Amazon vs Etsy: Which Online Marketplace Selling Strategy Wins for Small Importers — Compare platform fees, traffic, and profit potential for imported goods
- From Random Products to Reliable Sales: A Small Items Sourcing Plan That Delivers Profit — Build a product sourcing plan that feeds marketplace demand
- 10-Step Monthly Checklist for Small Importers Who Want Consistent Growth — Monthly tasks to maintain marketplace profitability across your supplier portfolio