

The Benchmark That Changed How I Source Products
I once watched a seller launch two products in the same week:
- Product A: A $30 kitchen scale (650g, bulky packaging, $18 shipping)
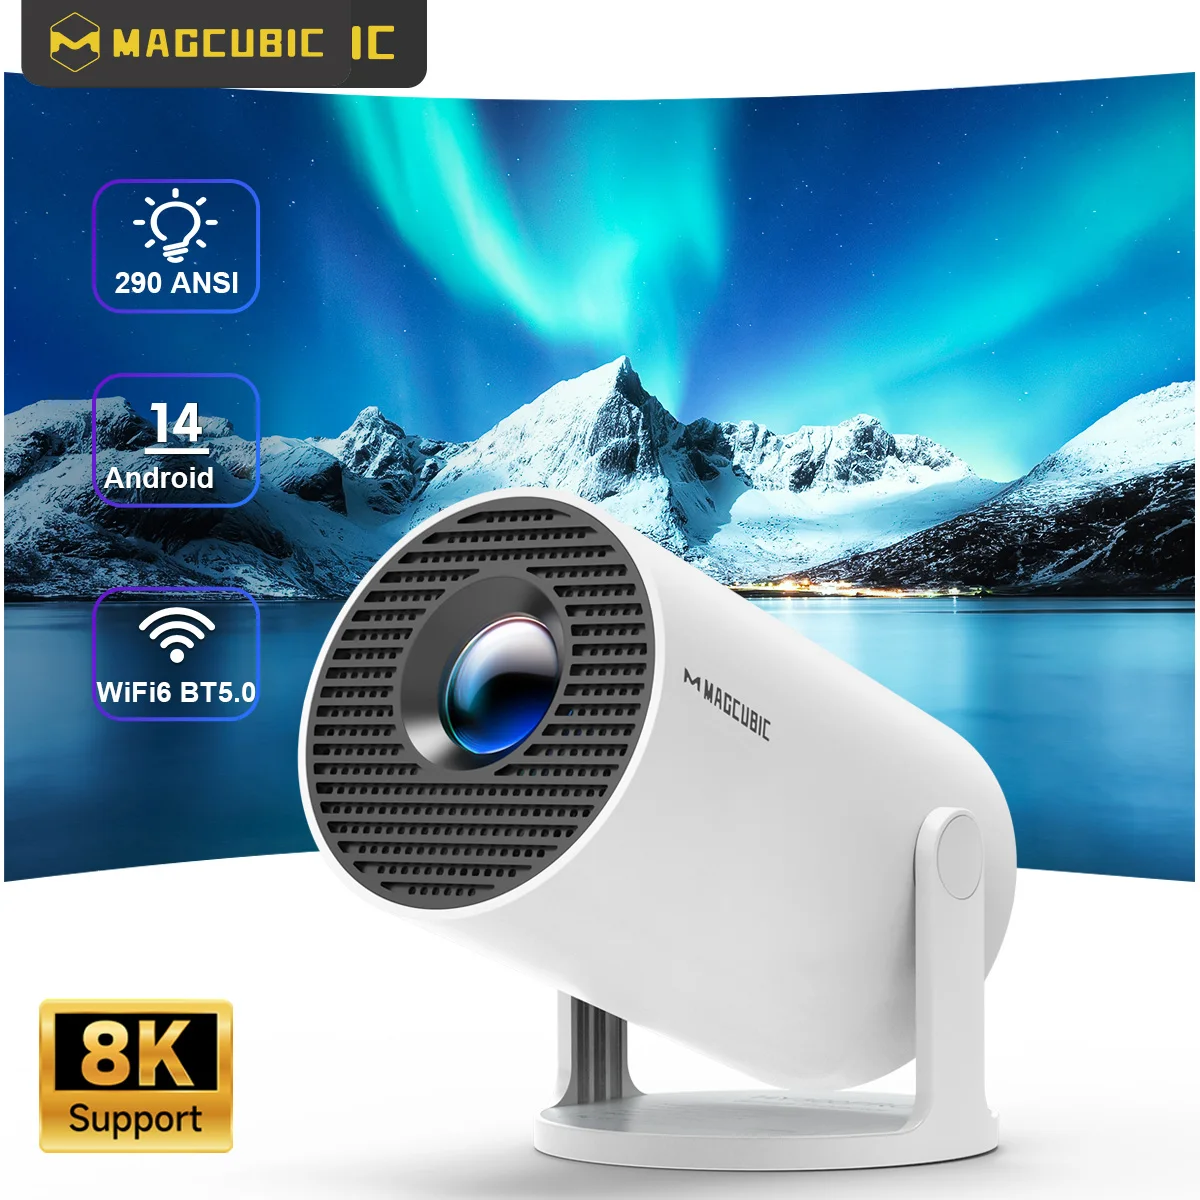
- Product B: A $120 pocket projector (180g, smartphone‑sized, $5.50 shipping)
Six months later, Product B had outsold Product A 4:1 in revenue and 7:1 in profit. The kitchen scale had higher conversion rates (lower price = easier buy), but the pocket projector generated more total profit because the margin structure was fundamentally better.
This is the Light‑Small‑Expensive paradox: lower‑priced products often have higher conversion rates, but higher‑priced lightweight products win on total profit — and they generate fewer support tickets, fewer returns, and more positive reviews.
Ai Translator Earbud Device Real Time 2-Way Translations Supporting 150+ Languages For Travelling Learning Shopping Business
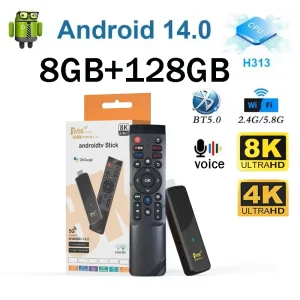
TV98 ATV X9 Smart TV Stick Android14 Allwinner H313 OTA 8GB 128GB Support 8K 4K Media Player 4G 5G Wifi6 HDR10 Voice Remote iptv
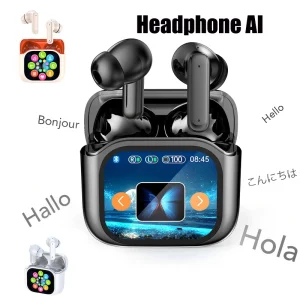
Smart AI Translation Bluetooth Earphones With LCD Display Noise Reduce New Wireless Digital Long Battery Life Display Headphone
The Profit Per Shipment Metric That Matters
Most sellers track conversion rate and gross margin. These are the wrong metrics. The metric that matters is Profit Per Shipment (PPS) — the net profit after all costs (product + shipping + platform fees + returns reserve) for each unit shipped.
Let’s compare:
- $30 kitchen scale: $8 product + $18 shipping + $6 platform fees + $3 returns reserve = $35 total cost. Net loss: -$5 per shipment.
- $120 pocket projector: $35 product + $5.50 shipping + $18 platform fees + $2 returns reserve = $60.50 total cost. Net profit: $59.50 per shipment.
The higher‑priced product generates 12× more profit per shipment despite lower conversion rates. This is the math that separates profitable sellers from volume‑chasing ones.
Three High‑Pocket‑Value Products That Win on PPS
Why Price Alone Doesn’t Explain the Difference
The Conversion Rate Trap
New sellers see a $30 product with a 5% conversion rate and a $120 product with a 1.5% conversion rate and conclude: “The $30 product is better — it converts 3× higher.” But this ignores margin math. A 1.5% conversion rate at $120 with 50% margin produces far more profit per 1,000 visitors than a 5% conversion rate at $30 with 20% margin.
The Returns Asymmetry
Heavy kitchen appliances have return rates of 8-15% (broken, not as expected, too heavy, wrong size). Lightweight tech products (projectors, streaming sticks, earbuds) have return rates of 3-6%. The difference in returns reserve cost compounds significantly at scale.
The Review Quality Gap
Lightweight, high‑value tech products generate detailed, enthusiastic reviews with photos and videos. Heavy commodity products generate one‑line reviews (“works fine”). Better reviews → higher conversion → lower ad costs → higher profit. It’s a compounding advantage.
How to Find Your Own $120 Pocket‑Sized Winner
- Search for “pocket‑sized” or “mini” versions of popular full‑size products — mini projector, mini camera, mini speaker
- Look for products under 200g with a clear “premium” angle — ceramic, titanium, carbon fiber, smart features
- Target $40-$150 price range — below $40 the margins get thin; above $150 conversion drops significantly
- Verify the competition is selling at $40-$150 for similar specs — if competitors are at $15, your premium positioning will be hard to defend
SEO Keywords
high profit products ecommerce, pocket sized gadgets, profitable product sourcing, high ticket lightweight products, profit per shipment metric, mini projectors profit margin, cross border ecommerce strategy 2026, Amazon FBA high margin products.
The Takeaway
A $30 heavy product can lose you money. A $120 lightweight product can make you a fortune. The difference isn’t the price tag — it’s the shipping cost, return rate, and margin structure. Stop chasing low‑price volume. Start chasing high‑profit lightweight products that the shipping system is designed to reward.
Frequently Asked Questions
Q: How long does it take to start making money from import business?
Most importers see first profits within 3-6 months. The first 2 months involve product research, supplier vetting, and sample ordering. Months 3-4 cover manufacturing and shipping. The final 2 months are for listing, marketing, and generating first sales.
Q: Do I need a business license to import products?
Most countries require a registered business entity and tax ID to import commercially. For small-scale selling, sole proprietorship or LLC registration is sufficient. Check your local business registration requirements as they vary by jurisdiction.
Q: What is dropshipping and how is it different from importing?
Dropshipping means the supplier ships directly to customers with no inventory on your end. Importing involves buying in bulk, storing inventory, and shipping yourself. Dropshipping has lower risk but lower margins. Importing offers higher margins with more control.
Q: How do I handle customer service for imported products?
Set up automated email responses for common questions. Use live chat during business hours. Create detailed FAQ pages on your site. Pre-ship quality checks reduce return rates. Respond to inquiries within 24 hours to maintain good seller ratings.
Q: What are common mistakes new importers make?
Top mistakes: ordering too much inventory without demand validation, choosing the cheapest supplier without verification, underestimating shipping costs, ignoring customs duties, pricing products too low, and neglecting trademark protection.
BEST SELLING
Ai Translator Earbud Device Real Time 2-Way Translations Supporting 150+ Languages For Travelling Learning Shopping Business
Experience seamless communication with our AI Translator Earbud, capable of real-time 2-way translations in over 150 languages, perfect for global…
Buy Now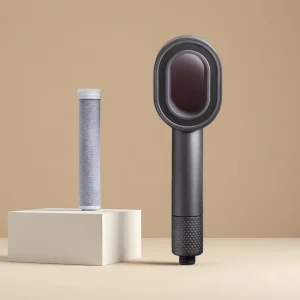
Light Luxury Bathroom Shower Filter Showerhead Beauty High Pressure Shower Head Water Sav
Light Luxury Bathroom Shower Filter Showerhead Beauty High Pressure Shower Head Water Sav
Buy Now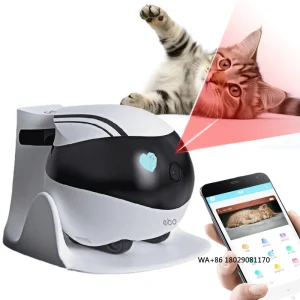
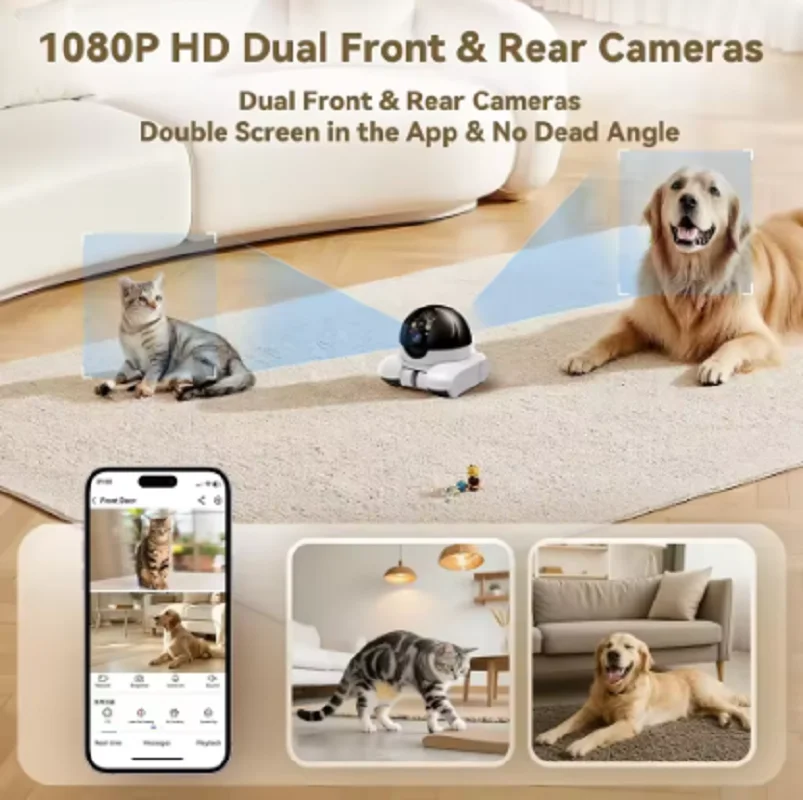
Control Teaser Interactive Toy 32G Cat Smart Companion Robot for Pets Baby Old Man 1080P HD Security WiFi Remote
Unusual Situation Warning. Automatically monitor abnormal situations and promptly push messages through the app.
Buy Now
Magnetic Wireless Charger Mount Vacuum Suction Cup Car Phone Holder Stand For iPhone 17 16 15 14 13 12 Pro Max Fast Charging
Magnetic Wireless Charger Mount Vacuum Suction Cup Car Phone Holder Stand For iPhone 17 16 15 14 13 12 Pro…
Buy Now
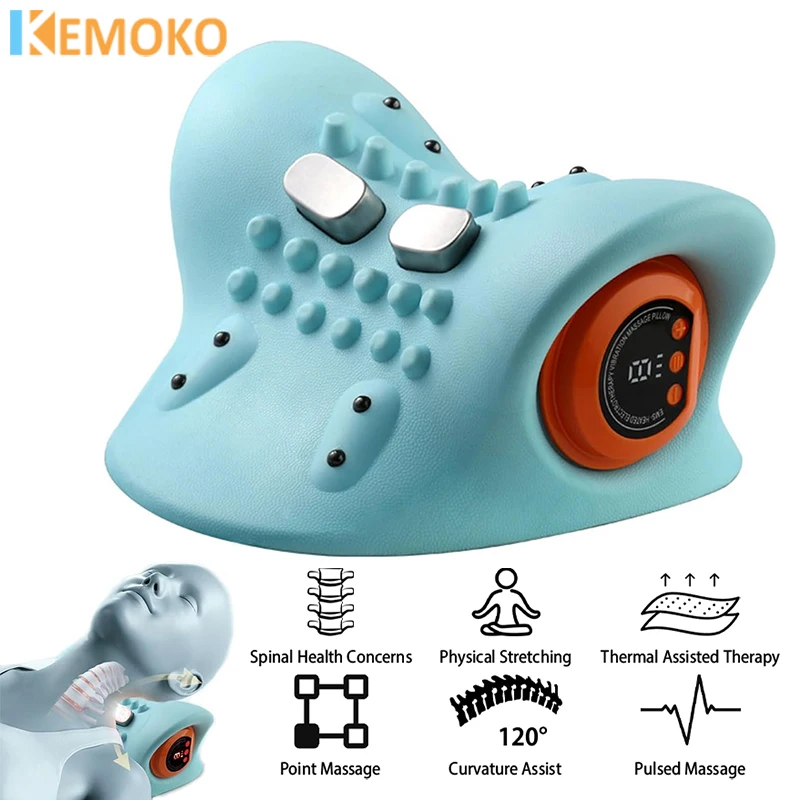
Electric Cervical Massager Neck Stretcher Pulse Traction Heating Pain Relif Chiropractic Traction Head Acupoint Massage Pillow
Electric Cervical Massager Neck Stretcher Pulse Traction Heating Pain Relif Chiropractic Traction Head Acupoint Massage Pillow
Buy Now
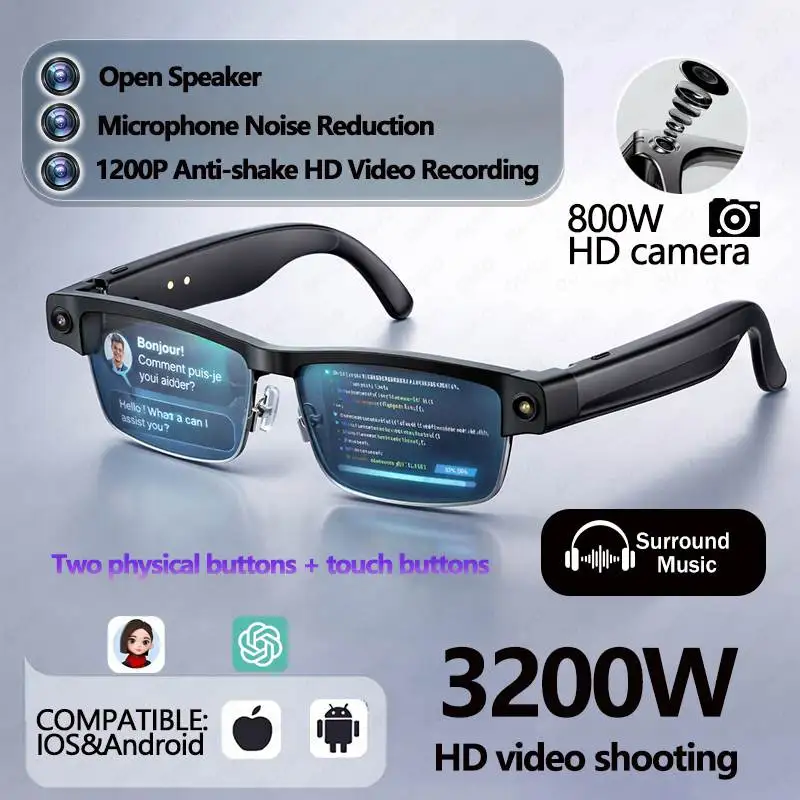
Smart AI Translation Bluetooth Earphones With LCD Display Noise Reduce New Wireless Digital Long Battery Life Display Headphone
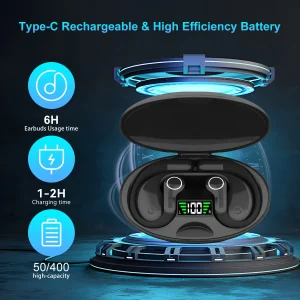
Motherboard solution: ChinaCache 5636E-ANC+ENC. Talk time: 7-8 hours. Earphone battery: 40 mAh.
Buy Now