








Returns are the silent profit killer in cross-border ecommerce. Many beginner sellers only see the gross margin and ignore the double hit of returns: you lose not just the product cost and shipping, but also the return shipping and processing fees. The actual cost of one return is typically 1.5–3 times the product cost. Based on industry data and real-world experience, this article breaks down return rates by category and provides actionable product selection strategies to minimize returns.
According to cross-border ecommerce data from 2025, the global average return rate is 15–20%. But rates vary enormously by category — clothing and footwear can hit 30–40%, electronics run 5–10%, home goods are 8–15%, and outdoor sports gear is just 5–8%. When selecting products, return rate matters more than gross margin. A product with 60% margin but 30% returns is likely less profitable than one with 40% margin and 3% returns.
Take the 2000X25 HD Monocular Telescope — optical products like this typically have return rates below 5%. Why? Because customer expectations are crystal clear: “see distant things more clearly.” As long as the product delivers this basic function, customers rarely return it. Another classic example is the Velec Smart TV Stick, with return rates of just 3–5%. Plug it into HDMI and it works — no ambiguity, no “expectation vs reality” gap.

Ai Translator Earbud Device Real Time 2-Way Translations Supporting 150+ Languages For Travelling Learning Shopping Business

Smart AI Translation Bluetooth Earphones With LCD Display Noise Reduce New Wireless Digital Long Battery Life Display Headphone

TV98 ATV X9 Smart TV Stick Android14 Allwinner H313 OTA 8GB 128GB Support 8K 4K Media Player 4G 5G Wifi6 HDR10 Voice Remote iptv
? Return Rate Ranking by Category
| Category | Avg Return Rate | Selection Advice |
| Clothing & Footwear | 30–40% | ⚠️ Beginners should avoid |
| Beauty & Personal Care | 15–25% | ⚠️ Strict quality control required |
| Home Decor | 10–18% | ✅ Stick to standardized products |
| Consumer Electronics | 5–10% | ✅ Choose mature categories |
| Smart Wearables & Accessories | 3–8% | ✅ Recommended for beginners |
| Outdoor & Sports Gear | 5–8% | ✅ Low returns, solid margins |
| TV Boxes & Streaming Devices | 3–5% | ✅ Lowest return category |
| Coffee Equipment & Kitchen Appliances | 4–8% | ✅ Controllable returns, high ticket |
? 4 Practical Strategies to Reduce Returns
Strategy 1: Choose “What You See Is What You Get” Products
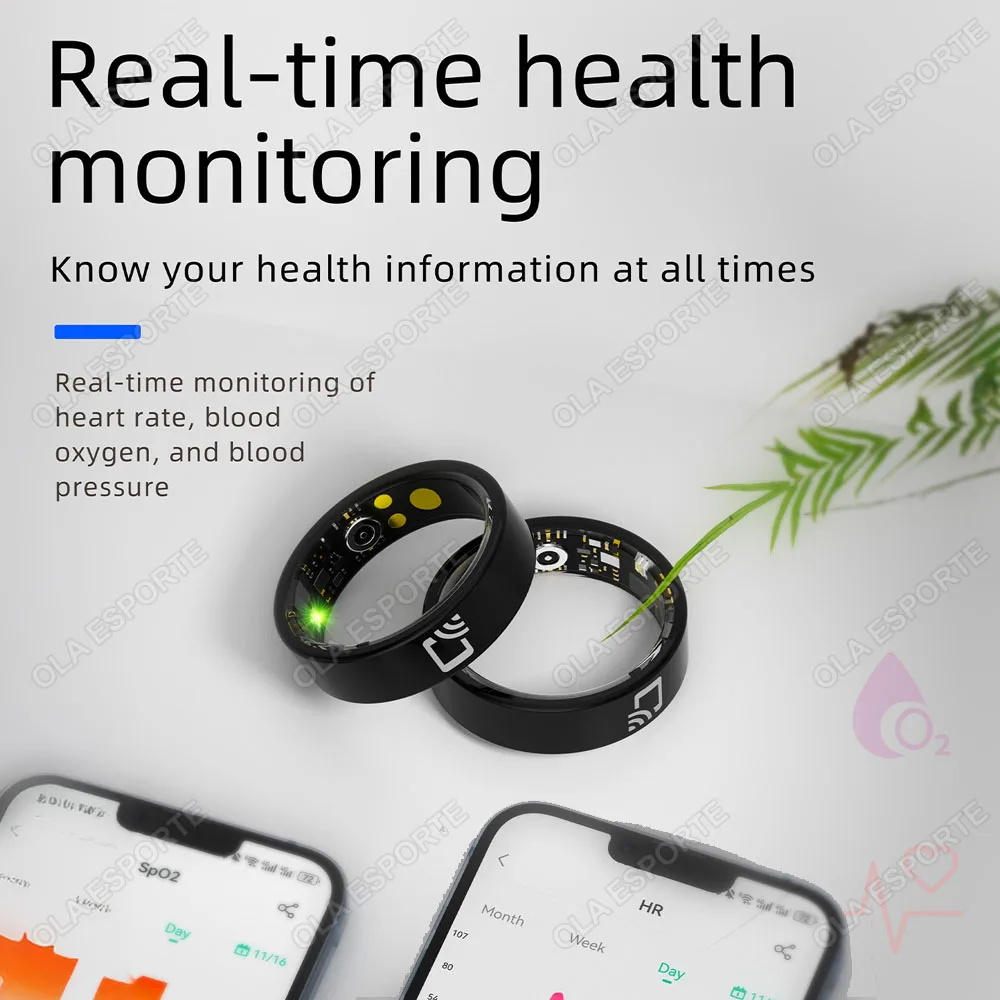
Returns happen because of the “expectation gap” — what the buyer expected vs what they received. Choose products with clear functions, simple use cases, and no room for misunderstanding. The Fashion NFC Smart Ring 2026 is a great example — buyers know exactly what it does (NFC access + health monitoring), so there’s no disappointment. Avoid effect-based products (whitening, weight loss, muscle building) — results vary by person, making returns extremely likely.
Strategy 2: Use Detailed Descriptions & Real Photos
The more detailed your product page and the more realistic your images, the lower your return rate. Include: multi-angle real photos (not just official renders), size reference images (a coin or ruler for scale), real-world usage shots, and video demonstrations. For products with dimensions, always provide a detailed size chart in both inches and centimeters.
Strategy 3: Invest in Proper Packaging
Many returns are caused by shipping damage. Use anti-static bags + foam padding + sturdy cardboard boxes (triple protection) for electronics. Secure all accessories (cables, manuals) to prevent them from rattling loose during transit. Good packaging doesn’t just reduce returns — it improves the unboxing experience, generating positive reviews and repeat purchases.
Strategy 4: Build a Return Data Analysis System
Record the reason for every single return (wrong size? quality defect? not as described? shipping damage?) and analyze the data regularly. If any product’s return rate exceeds 2x the category average, consider delisting it or switching suppliers immediately. Continuous product line optimization is the most effective way to control returns.
✅ Recommended Low-Return Product Categories
- Optical Equipment (telescopes, microscopes) — return rate 3–5%
- TV Boxes & Streaming Devices — return rate 3–5%
- Smart Wearables (NFC rings, smart bands) — return rate 3–8%
- Kitchen Appliances (coffee machines, grinders) — return rate 4–8%
- Car Electronics (dashcams, CarPlay modules) — return rate 5–8%
When selecting products, give return rates equal weight to profit margins. A winning product is one that combines high profit + low returns + light & small + clear use case into a perfect formula. Master return risk avoidance, and your cross-border business can achieve true sustainable profitability.
Have you been burned by high return rates in cross-border ecommerce? Share your story and help others avoid the same mistakes!
Frequently Asked Questions
Q: How do I find profitable products to import?
Start by analyzing Amazon Best Sellers Rank, Google Trends, and social media trends. Look for products with steady demand, low competition, high profit margins (40%+), and lightweight construction for affordable shipping. Avoid seasonal or trendy products.
Q: What product research tools do you recommend?
Jungle Scout and Helium 10 are excellent for Amazon product research. Google Trends shows search demand patterns. Alibaba's search data reveals trending export products. AliExpress product views can indicate consumer interest for cross-border e-commerce.
Q: What product categories are best for import beginners?
Start with lightweight, non-perishable, non-regulated products. Popular categories include accessories, home organization items, phone accessories, pet supplies, fitness gear, and kitchen gadgets. These have lower entry barriers and shipping costs.
Q: What profit margin should I target for imported products?
Target a minimum 40-50% gross margin on landed cost (product + shipping + duties). After marketplace fees, advertising costs, and returns, aim for 15-25% net profit. Products with margins below 30% are difficult to scale profitably.
Q: How many products should I test in my first order?
Start with 3-5 products with small quantities (100-200 units each). This keeps your upfront investment under $2000-3000 while giving enough data to identify winning products. Scale winners and drop underperformers after 2-3 months of sales data.
BEST SELLING
Ai Translator Earbud Device Real Time 2-Way Translations Supporting 150+ Languages For Travelling Learning Shopping Business
Experience seamless communication with our AI Translator Earbud, capable of real-time 2-way translations in over 150 languages, perfect for global…
Buy Now
Light Luxury Bathroom Shower Filter Showerhead Beauty High Pressure Shower Head Water Sav
Light Luxury Bathroom Shower Filter Showerhead Beauty High Pressure Shower Head Water Sav
Buy Now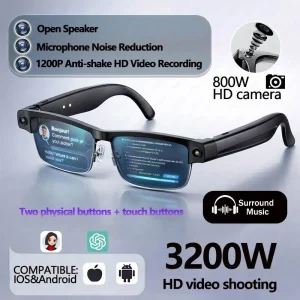
Al Smart Photo Glasses 800W Camera 1200P anti-shake HD Video Recording Translation Voice Assistant Music BT Call Smart Glasses
Voice Assistant Function. Access your world effortlessly with the integrated voice assistant, making hands-free operation a breeze.
Buy Now
Pet Surveillance Camera 360° Robot Camera WIFI Dual Lens Cameras Dual Screen Monitoring 1080P HD PTZ IP Security Surveillance
Dual-lens surveillance video: dual-lens design, two-way rotating monitoring, dual-screen viewing at the same time, home, store, yard door panoramic view,…
Buy Now
Magnetic Wireless Charger Mount Vacuum Suction Cup Car Phone Holder Stand For iPhone 17 16 15 14 13 12 Pro Max Fast Charging
Magnetic Wireless Charger Mount Vacuum Suction Cup Car Phone Holder Stand For iPhone 17 16 15 14 13 12 Pro…
Buy Now
Electric Cervical Massager Neck Stretcher Pulse Traction Heating Pain Relif Chiropractic Traction Head Acupoint Massage Pillow
Electric Cervical Massager Neck Stretcher Pulse Traction Heating Pain Relif Chiropractic Traction Head Acupoint Massage Pillow
Buy Now